Look Mum No Pixels: a Mini Vector Display
2024-07-19 — 2024-10-29Vector Displays
A Vector Display is an unusal form of CRT display.
A conventional “raster” display moves the electron beam through a predefined pattern and then modulates the strength of the beam to produce an image of varying brightness, so is limited to a set number of “scan lines”. Each scan line is broken up into pixels, and the computer displays drawings or images by changing the brightness of the array of pixels. The size of the pixels sets the resolution of the display.
By contrast a vector display just steers the electron beam to where it wants to draw, and can therefore draw lines with resolution limited only by the “focus” of the beam.
Vector displays were used a bit in the early days of computing and some arcade games, but the only widely available vector display I’m aware of is the Vectrex home game console from 1982.
The Project
I’d already started on this project when I stumbled upon Jeroen Domburg’s “Building a Portable Vectrex, The Right Way” which does way more with this than I have any intention of doing, but hopefully this little project will still be fun …
The aim is to make some kind of retrofuturistic clock / weather display, with the mini CRT mounted in a 3D-printed Jetsons-esque housing. Kind of like a Nixie Clock but featuring a nice curvy outline font and squircles.
Micro CRT
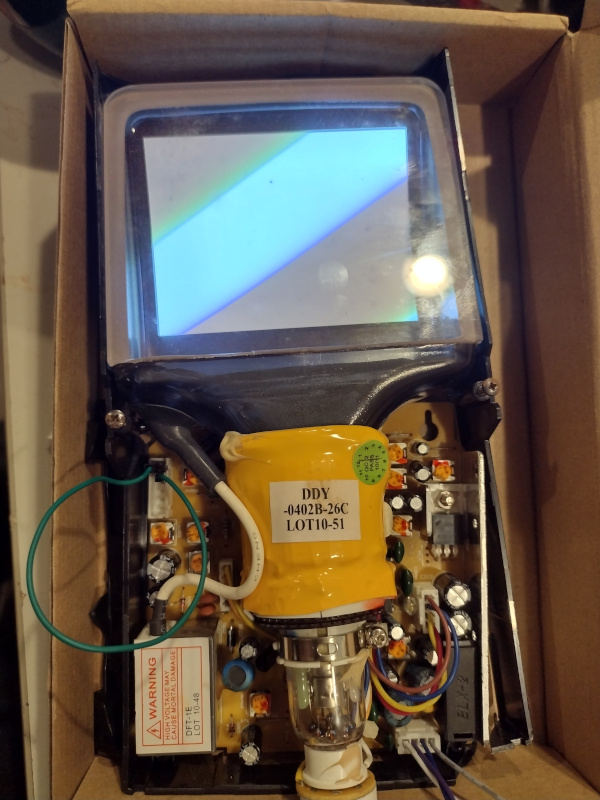
There’s a bunch of “Micro CRT”s on Ebay, there are a lot of different sellers but they’re all pretty much the same as the one I bought, with a 4 inch Flat CRT tube with power supply and composite video circuitry.

|

|

|
The ones on Ebay seem to have part numbers like VIS4001D, VIS4001EA or VIS4001EC,
but this one is labelled YC-103A.
The yoke is also labelled DDY-0402B-26C LOT 10-51.
On the reverse of the tube is a label: Direct Heating Flat Picture Tube 12SXP45ZRG
Resources
- “Experiment with Sony flat 4inch CRT” [archive.org]
- tweet by ZxSpectROM
- Jerry Walker on youtube
- DiodeGoneWild on youtube
By a curious coincidence I spotted one of these in the wild!
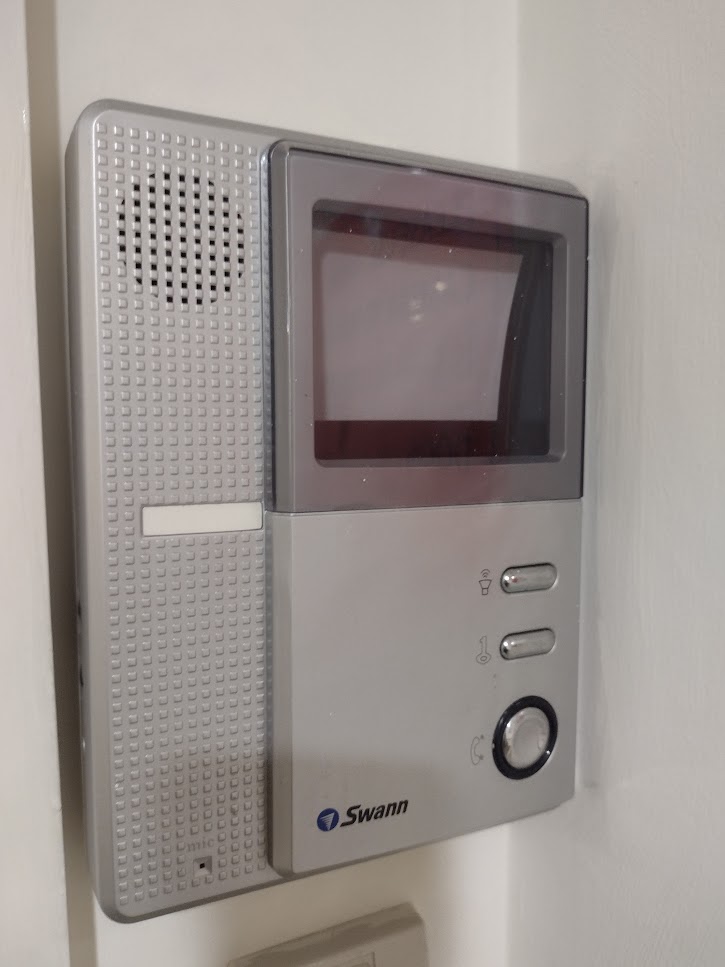 Swann Video Intercom
Smoke Test
The unit arrived swiftly and even though the plastic chassis was broken it seems to work. Providing power though the power/video input connector and jumpering the top two brightness control contacts (I didn’t have a 6 pin connector handy) was enough to get the whole screen to light up even with no composite input:
(The whole rectangle of phosphor is lit up evenly, I just didn’t get the phone camera configured right to get a decent photo.)
Interestingly, it’s pretty obvious close-up that the tube is made of three separate pieces of glass. The neck, the curved back / phosphor and the flat front glass appear to have been cemented together before the tube was evacuated and pinched off in the normal manner.
Note that unlike the phosphor surface on a normal CRT which has phosphor on the front, with this device you’re looking through the flat front side to the phosphor on the back side.
The 6kV connector on the shoulder of the tube is protected by a small rubber boot but this is removeable so the housing will have to cover it for safety.
Connectors
There’s a six-pin connector for brightness/contrast pots, and a 4 pin connector for power and composite video. These seem to be JST XH 2.5 as commonly used for multi-cell LiPo packs.
A 5 pin header on the board connects to the 7 pin connector on the base of the CRT, presumably this is for the heater, grid, etc. Another 4 pin JST XH connects to the yokes.
Power
The sticker on the side of the assembly says DC12V 5W.
There’s an internal 1A fuse.
Running at 12V, it seems to draw about 380mA.
This tweet includes an infrared image of a similar board with the TO220 regulator clocking in at 56.3⁰C, which suggests that a large proportion of the power consumption is getting radiated from that device alone.
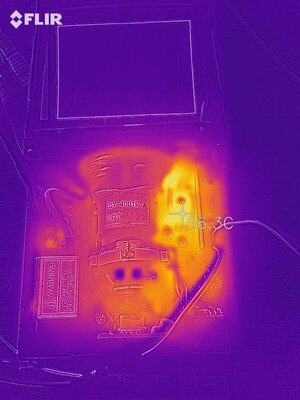 Image: ZxSpectROM on Twitter
By contrast, the tube itself and the “may cause mortal damage” HV power module seem to run fairly cool. This is good because I’ll want to make a 3D printed housing for this thing eventually.
I think all power is routed through the LM7810 regulator so the whole device could be made >15% more efficient by replacing this part with a more efficient regulator.
The chip at the heart of this circuit, the LA7806
has two separate power pins called
V12 and V15, on pins 12 and 15 respectively.
Both have a recommended voltage of 12V, and a maximum of 14V.
No minimum voltage is listed but this board appears to run both from the regulator
at 10V.
Displaying Composite Video
To prove this thing actually works I’d like to get it displaying from a composite video source. Composite isn’t that common these days — most things have moved on to HDMI — but I’ve got a couple of old toy video game devices which output PAL composite so let’s see how it goes.
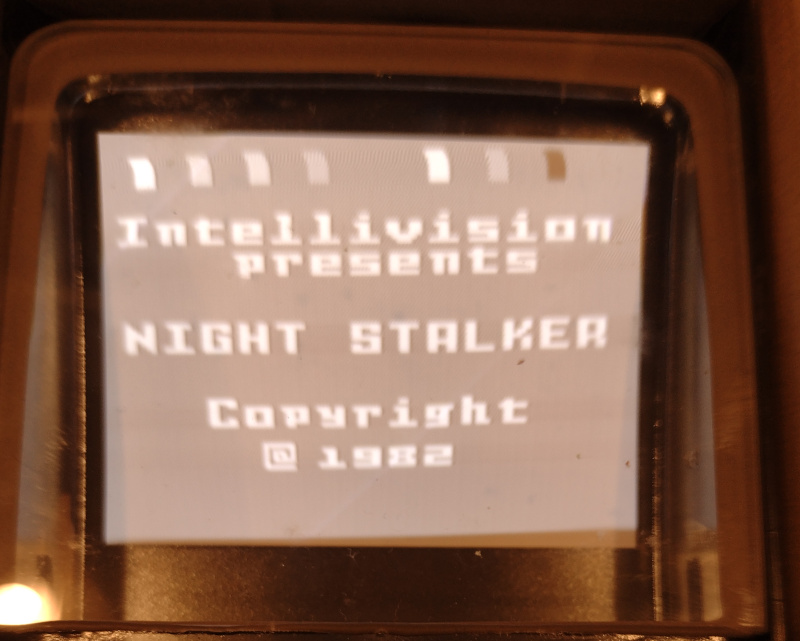 Intellivision presents NIGHT STALKER
Well, with some judicious twiddling of trimpots it does work, although it isn’t exactly precisely aligned. Hopefully it’ll work a little better in vector mode …
Taking Control
What I actually want is to control the horizontal and the vertical deflection separately, and possibly the beam intensity as well.
This would then let me implement a vector display for a microcontroller.
CRO prototype
Controlling the actual device may prove a little tricky, and I need to order some more parts, so let’s start with the simplest possible thing.
I already have a device which can act like a vector CRT … my old Tektronix 2225 oscilloscope, which I pulled out of a skip at Monash Uni many years ago.
And I have any number of microcontroller boards in the junkbox. The ESP32 runs micropython and has two 8-bit DACs on board, so let’s go with that for the moment.
Later on I’ll probably want to find something with an in-built RTC or else find a I²C RTC module or something.
Python Code
There’s some code up at github:nickzoic/mini-vector
points
We can start off by defining an array of points to visit:
points = [
        (0.0, 0.0),
        (0.0, 1.0),
        (0.25, 1.0),
        (0.75, 0.5),
        (0.75, 1.0),
        (1.0, 1.0),
        (1.0, 0.0),
        (0.75, 0.0),
        (0.25, 0.5),
        (0.25, 0.0),
]
Here’s how lines between those points would look plotted:
 a big N
micropython-itertools
implements a lot of the core python itertools, including a handy function cycle
which repeats an iterable indefinitely, so cycle(points) runs through all the points
in an endless loop.
If you don’t have itertools installed you can always define this function yourself:
def cycle(iterable):
    while True:
        yield from iterable
segments
At this point, I wanted to loop over each line segment.
Unfortunately, micropython-itertools doesn’t include pairwise,
so I had to implement that myself:
from itertools import cycle

def pairwise(iterable):
    it = iter(iterable)
    a = next(it)
    for b in it:
        yield a, b
        a = b
now we can easily step through the line segments like this:
for (x1, y1), (x2, y2) in pairwise(cycle(points)):
    print (x1, y1, x2, y2)
now we’ve got each line segment, what are we going to do with it? Let’s try breaking it up into a number of intermediate points,
def interpolate(iterable_of_pairs_of_points, steps=8):
    for (x1, y1), (x2, y2) in iterable_of_pairs_of_points:
        for s in range(0,steps):
            f = s / steps
            x = x1 * (1-f) + x2 * f
            y = x1 * (1-f) + y2 * f
            yield x, y
writing to the DACs
from machine import Pin, DAC

dac_x = DAC(Pin(25))
dac_y = DAC(Pin(26))

for x, y in interpolate(pairwise(cycle(points))):
    dac_x.write(int(x*255))
    dac_y.write(int(y*255))
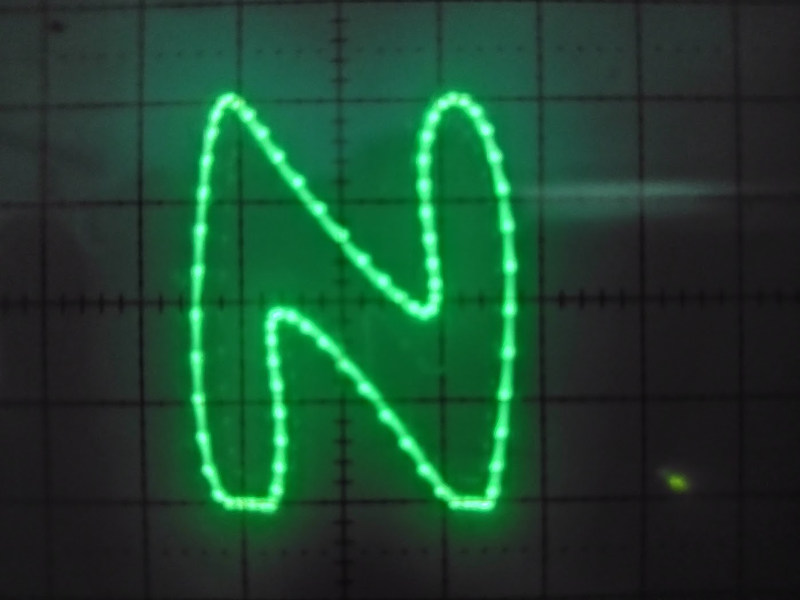
This isn’t nice but it’s enough to get us something:
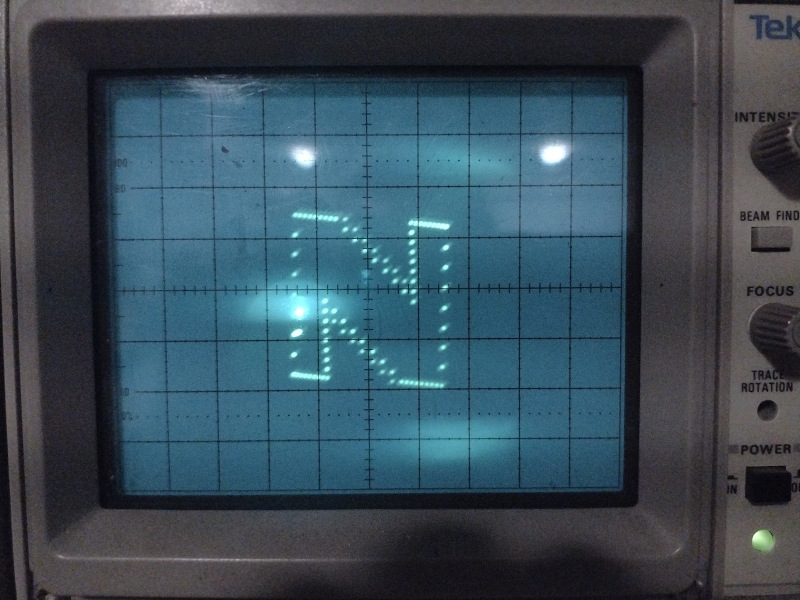 big N on the oscilloscope
It works, despite some pretty big problems with this code:
- the number of points per segment is fixed, so the density of points depends on the length of the segment
- if you look at the diagonals, you can see that updates of X and Y aren’t happening in sync, there’s quite a long delay on each write resulting in a 16 point “stair step” between the 8 points.
- even the densest lines aren’t smooth enough not to look like lines of dots.
- the update rate isn’t high enough to increase the number of points much.
- there’s a big of crosstalk between the DAC pins (thus the sloping lines)
Fortunately, we can get around a lot of these problems using I²S. Using I²S lets us stream coordinates out to the display at set time intervals without having to worry about the rest of our code keeping up in real time.
The ESP32’s I²S can allegedly be routed to the in-built DAC pins but this is deprecated.
But I do have a PCM5102A based I2S DAC module in the junkbox which will give me 2 × 16 bit channels at quite a high sample rate, and includes digital filtering to remove artifacts.
Let’s hook it up and see what happens. I’m using the chip in “System Clock PLL Mode”, which just needs a three wire interface:
| machine.I2S Parameter | ESP32 Pin | GY-PCM5102 Pin |
|---|---|---|
| sck | GPIO 32 | BCK |
| sd | GPIO 33 | DIN |
| ws | GPIO 25 | LRCK |
To enable this mode, SCK should be pulled low.
In this mode, if you feed it an appropriate BCK (data bit clock) and LRCK (data word clock)
it’ll work out its own SCK (system clock) which saves a bit of messing around.
Some setup pins are also required, and are set using solder jumpers on the module board:
| GY-PCM5102 Pin | State | Purpose | Setting |
|---|---|---|---|
| DEMP | L | De-emphasis | Off |
| FLT | L | Filter Select | Normal |
| FMT | L | Audio Format | I²S |
| XSMT | H | Soft Mute | Un-mute |
The two audio output channels L and R are then connected to X and Y axes of the ‘scope respectively.
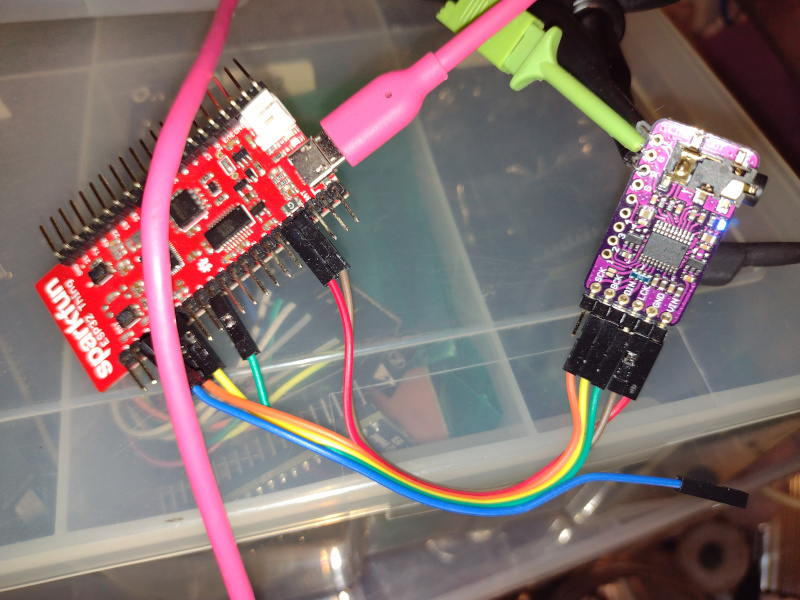 experimental setup with ESP32 and PCM5102 boards
Now we can write some Python code to configure the I2S port, based on this micropython i2s example:
from machine import I2S, Pin

I2S_ID = 0
SCK_PIN = 32
WS_PIN = 25
SD_PIN = 33
BUFFER_LENGTH_IN_BYTES = 20000
SAMPLE_RATE_IN_HZ = 22050

i2s_out = I2S(
    I2S_ID,
    sck=Pin(SCK_PIN),
    ws=Pin(WS_PIN),
    sd=Pin(SD_PIN),
    mode=I2S.TX,
    bits=16,
    format=I2S.STEREO,
    rate=SAMPLE_RATE_IN_HZ,
    ibuf=BUFFER_LENGTH_IN_BYTES,
)
Then all we need to do is fill up a buffer and write it continuously. When the write buffer
is full, the i2s_out.write() will block, which saves us from worrying about asynchronous
operation.
buffer = pack("<" + "h" * (2*len(points)), *[int(z * 0x8000 - 0x4000) for x, y in points for z in (x,y)])
try:
    while True:
        i2s_out.write(buffer)
finally:
    i2s_out.deinit()
This is what it looks like on a DSO:
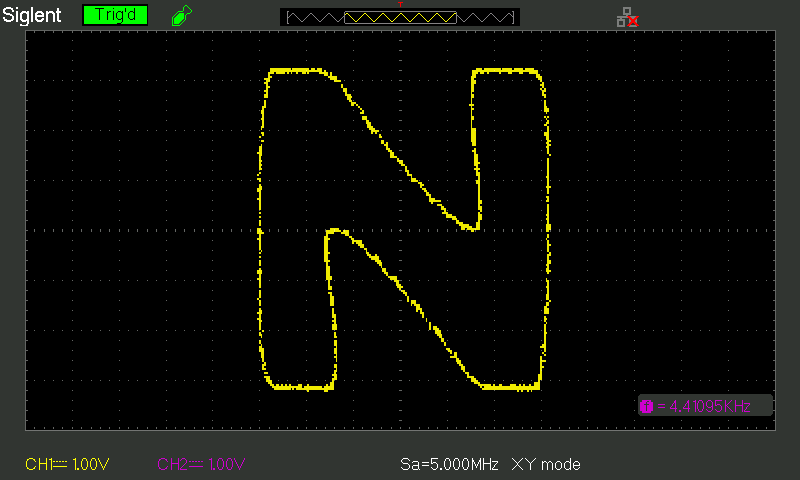
If you look at the trace on the CRO, you can see that the beam still lingers a little on intermediate points: those aren’t introduced by my code, rather the 8x digital interpolation filter on the PCM5102 is doing it for us. A little bit of analogue filtering should help remove the discontinuities. At least there’s no stair-stepping on the diagonals.
Adding in some of our own interpolation and/or running at a lower refresh rate should also make the straight lines straighter. It’s currently refreshing at 2.2kHz which is a lot higher than it needs to be!
Rendering Text
According to the datasheet, in “System Clock PLL Mode”, the PCM5102 can operate at 32, 44.1, 48, 96, 192 or 384 kHz sample rates.
My “Big N” has 10 points. If we’re emitting points at 48kHz and we want to have our image refresh at ~50Hz, that’s a maximum of ~960 points per image, which should be more than enough for our clock application, even allowing for some extra interpolation of longer line segments.
The electron beam intensity can be modulated to alter the brightness of the line drawn, but I’m hoping that it’ll be sufficient to move the beam very rapidly to “skip” between lines. Then I can just wire the beam intensity for full power. This will save having a third output channel to coordinate.
Loading fonts.
The big N is a good start, but I want to do something nice as a font.
The only characters I actually need are digits.
Each of these could be represented as a series of points, or multiple loops
if I want to draw “outline” characters.
What I need is an array of points for each character. To get them I
just opened up an inkscape document, picked a nice font (“TeX Gyre Bonum”),
typed in 0123456789: and then
converted that text with “Path » Object to Path” and then saved it as
an SVG.
 characters
 0123456789: in TeX Gyre Bonum, as SVG paths
Then I wrote
a script to convert the SVG paths
using xml.dom.minidom and svg.path.parse_path.
Each character gets converted to an SVG Path. Each path is a series of line segments (straight or splines) but we don’t want to deal with SVG on the microcontroller so what we do is covert each of them into a series of points, interpolating points on the longer strokes to make sure they have the correct shape. The script them emits these point lists as python code so they can get imported in MicroPython.
# simplified version for clarity

with minidom.parse(sys.argv[1]) as doc:
    for path in doc.getElementsByTagName('path'):
        for segment in parse_path(path.getAttribute('d')):
            for l in range(0, int(segment.length())+1):
                point = segment.point(l)
                print(point.real, point.imag)
That’s enough to get some nice curvy digits displayed on the CRO … which in my excitement I didn’t take photos of.
Multiple Digits
Instead I just moved on to multiple digits. Setting the i2s port up as before, this code just combines the paths for three digits and writes them out, updating the paths every time the time changes:
while True:
    t = time()
    points = \
        [ ((x+0)/3, y) for x, y in characters[t//100%10] ] + \
        [ ((x+1)/3, y) for x, y in characters[t//10%10] ] + \
        [ ((x+2)/3, y) for x, y in characters[t%10] ]
    buffer = pack("<" + "h" * (2*len(points)), *[int(z * 0xFFFF - 0x8000) for x, y in points for z in (x,y)])

    while t == time():
        i2s_out.write(buffer)
Multiple digits don’t work so well:
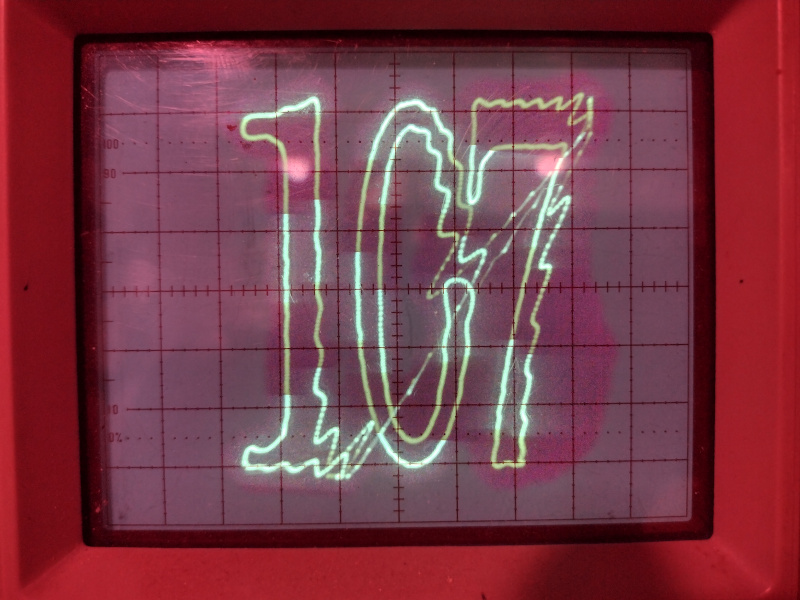 multiple digits don’t work quite so well (CRO)
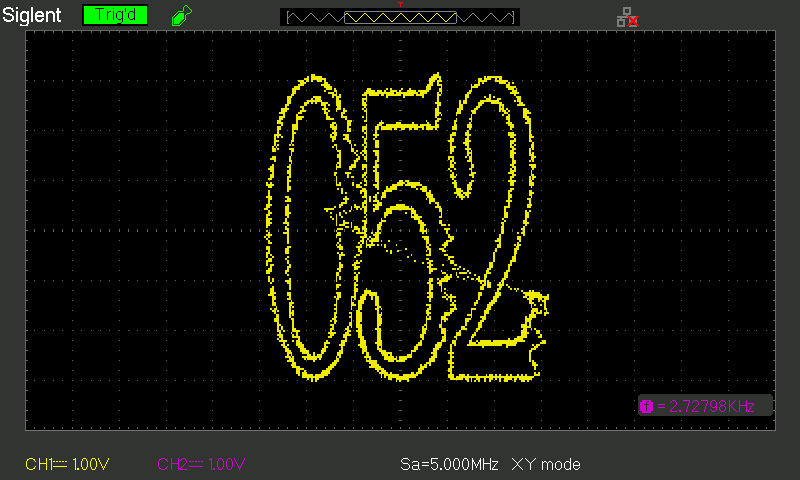 multiple digits don’t work quite so well (DSO)
(or watch a very boring video on youtube)
I attempted to “lift the pen” by moving the beam very quickly between strokes, but the built-in digital filtering on the I2S module works against us here, with the digital filter “ringing” both before and after each abrupt movement. That’s because the impulse response of the digital filter looks like this:
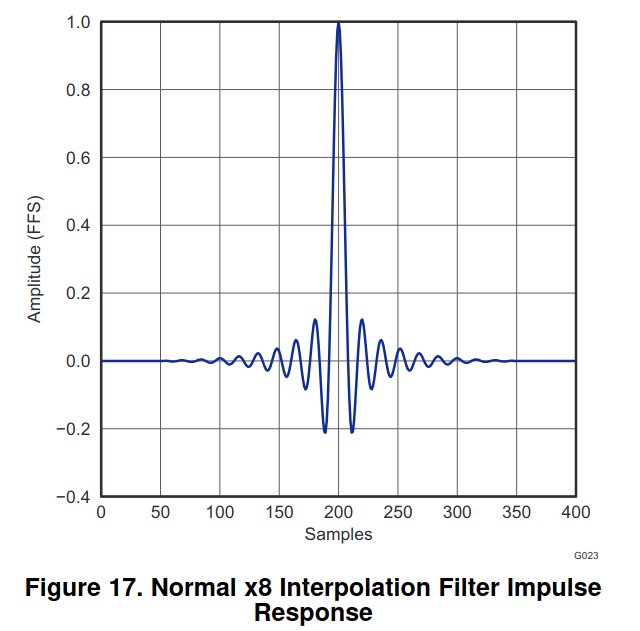 impulse response from the PCM5102 datasheet
It’s not magic, actually the entire signal is delayed by 20 samples (= 160 interpolated samples) to produce this clean filter effect.
Lifting the pen
So that strategy isn’t going to work too well.
With I²S, I can’t easily use a separate GPIO to shut down the beam because I don’t know
how long the I²S buffer is delaying the outputs by, so my beam shutoff signal
would be out of sync with my beam position signals.
It’s a pity there’s no quadraphonic I²S modules so I could have beam intensity as a third synchronized channel :-).
One possibility would be to switch off the filter … the datasheet mentions “x1 (bypass)” mode, but I can’t find any documentation on how to do so. I could also switch to a simpler I²C DAC like the MCP4725 / MCP4728 since I can do the digital filtering myself already.
Not lifting the pen
Or maybe I should approach it in a different way and consider using a continuous script font instead of numerals!
The paths as generated from SVG start and end at arbitrary positions and tangents, and any “inner loops” are just stuck on the end, meaning the ‘jumps’ are quite long and at strange angles.
Perhaps I could modify the “font” to make sure all paths enter and leave at the same position and tangent, eg: always along the bottom of the digits. That might reduce the visibility of the ringing effect since it will occur only in a straight line.
The smaller jumps — eg: between inner and outer loops of the 0 —
don’t seem to be as big a problem, although the outer loops go anticlockwise and
the inner loops go clockwise. It’s pretty easy to edit the paths manually
since they’re each just an array of points:
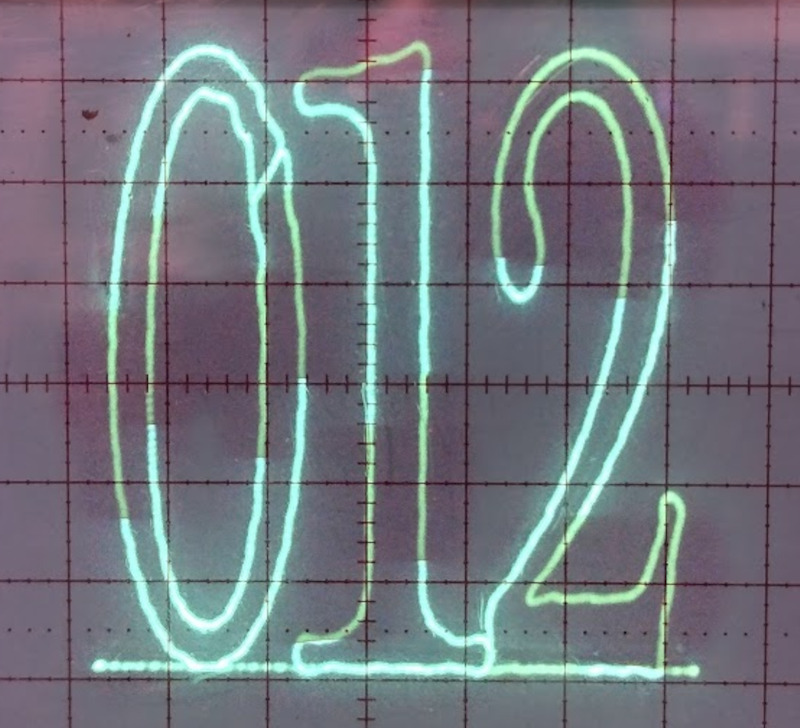 hand-altered font for digits 0, 1 and 2 improves the “ringing” situation a lot
With a bit of manual anipulation, the digits 0, 1 and 2 can be made quite presentable.
I changed all loops to be counter-clockwise, and start and end each digit at the
center bottom (see characters.py)
And I changed the link between inner and outer loops of the 0 to be at a nice
angle.
Plus I added an extra point between each digit and some more points to control the “retrace” back from the last digit to the first. There ends up being a fixed “underline” on the screen as the beam re-traces but maybe that’s more a visual eccentricity than a bug. I could also just retrace by playing all the points in reverse as a way of avoiding this.
So far I’ve only optimized digits 0, 1 and 2 so I’ve set it up to count in ternary, and you can watch an example on youtube. Note how the refresh rate changes depending on the total number of points displayed!
UPDATE: I’ve done a few more digits.
I haven’t done all of them yet. 8 might be a bit tricky and I’m not sure how to display the :.
It turns out 5 is wrong, well actually everything BUT the 5 is wrong because the 5 has
a cool little ascender which I didn’t allow for.
Making these edits is pretty complicated and time-consuming, a less manual way to do
this would be required if I wanted to support more fonts and/or characters.
Overall this ends up looking fairly nice I think and is probably a good enough approach to move forward with even if I can’t blank the beam.
Back to the CRT
OK, messing around with ‘scopes is one thing, but let’s try getting the CRT working. There’s no way I’m going to try to make a whole new driver board for this thing.
The existing board is based on a Sanyo LA7806 B/W TV Synchronization, Deflection Circuit … a 16 pin IC which decodes the sync pulses from composite video, and sends out horizontal and vertical deflection signals.
There’s a lot of analogue circuitry on this board which presumably handles the grid and yoke drivers and mixes horizontal and vertical to match the weird geometry of the picture tube. I’d rather not have to recreate that either, although I suppose it wouldn’t be impossible in software.
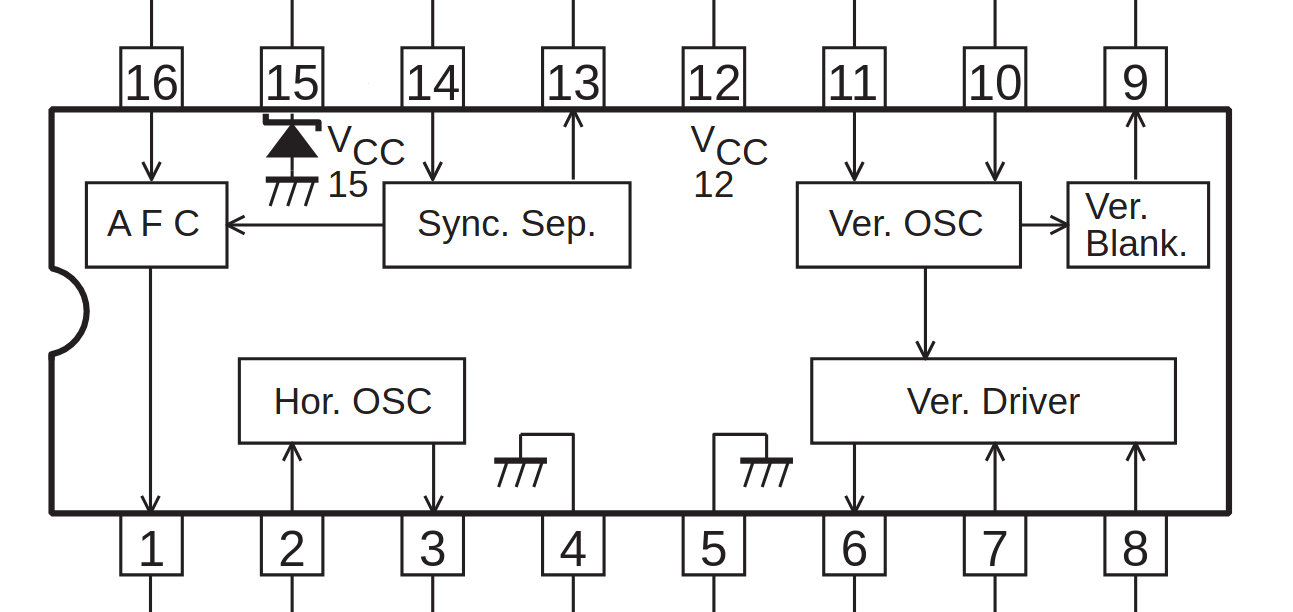 Image: Excerpt from LA7806 datasheet
The datasheets for this chip are pretty minimal, so first things first, I’ll get it working with a composite video input and check out the signals on pins 3 and 6. These should be horizontal and vertical drive respectively, in the sample circuit on the LA7806 datasheet both of these pins drive the bases of NPN transistors directly so they are presumably current sources.
Hopefully I can just de-solder the LA7806 and feed my own signals into the board instead.
WORK NOT IN PROGRESS
At some point while trying to understand the circuit around the LA7806 I think I shorted something and now … not a sausage. So this project is on hold until I get around to buying another mini CRT, or finding a CRT which will be easier to modify.
Hopefully the work on vector fonts will be useful to someone!
UPDATE
Dajgoro wrote to say:
Bad news, it can’t be done, at least not with the circuit the telly has. 😕 I spent some time reversing the circuit and I managed to control the brightness simply via the composite and using a function generator drew some bars. I also managed to drive the vertical, skew the picture and whatnot, but then I was puzzled about the horizontal. I tried figuring out where the sawtooth wave is, but there isn’t one. There is no horizontal at all, its a lie!
See how it drives a transformer and not a yoke coil, when probed all I could see is square waves, and when hijacked the telly just stopped working. When I’d probe the horizontal yoke I’d see 200V. The way it actually works is that the yoke is wired in series with the flyback transformer, and as the transformer switches and generates the high voltage it also drives the horizontal yoke. The reason they did it that way is because the yoke is very inductive and it needs a lot of power to drive, and since the telly always scans the same way they just wired it together. This also probably explains why your telly died, you probably messed up the horizontal burning the hv supply or something around it.
So, yeah, I probably killed that flyback but at least I didn’t kill myself!